The silver market has delivered one of the most dramatic moves in the broader commodities complex this year. In late December 2025, spot silver (XAG/USD) briefly surged to fresh all-time highs above $80/oz before pulling back sharply on profit-taking, highlighting just how volatile the silver price has become.
For traders and long-term investors alike, the key question is no longer whether the silver market is “active”—it clearly is. The more useful question is: what mix of macro drivers, industrial demand, and supply constraints is actually moving the silver price—and what could keep moving XAG/USD into 2026?
Below is IVTFX’s structured view of the silver market, focusing on the most repeated drivers behind the silver price, the supply/demand picture, and actionable scenarios for XAG/USD risk management.
Silver market snapshot: price action and the volatility regime
Silver’s late-2025 action has been defined by two realities:
- Momentum is real: Silver pushed into record territory intraday, with Reuters reporting a spike to $83.62/oz before a notable retreat to the mid-$70s.
- Volatility is real: The same market that can rip higher can also drop several percent in a single session—classic behavior when positioning, liquidity, and narrative collide.
This matters for anyone analyzing the silver market, because a high-volatility silver price environment changes how you size trades, where you place invalidation levels, and how you interpret breakouts in XAG/USD.
The macro engine behind XAG/USD: rates, the dollar, and “hard-asset” demand
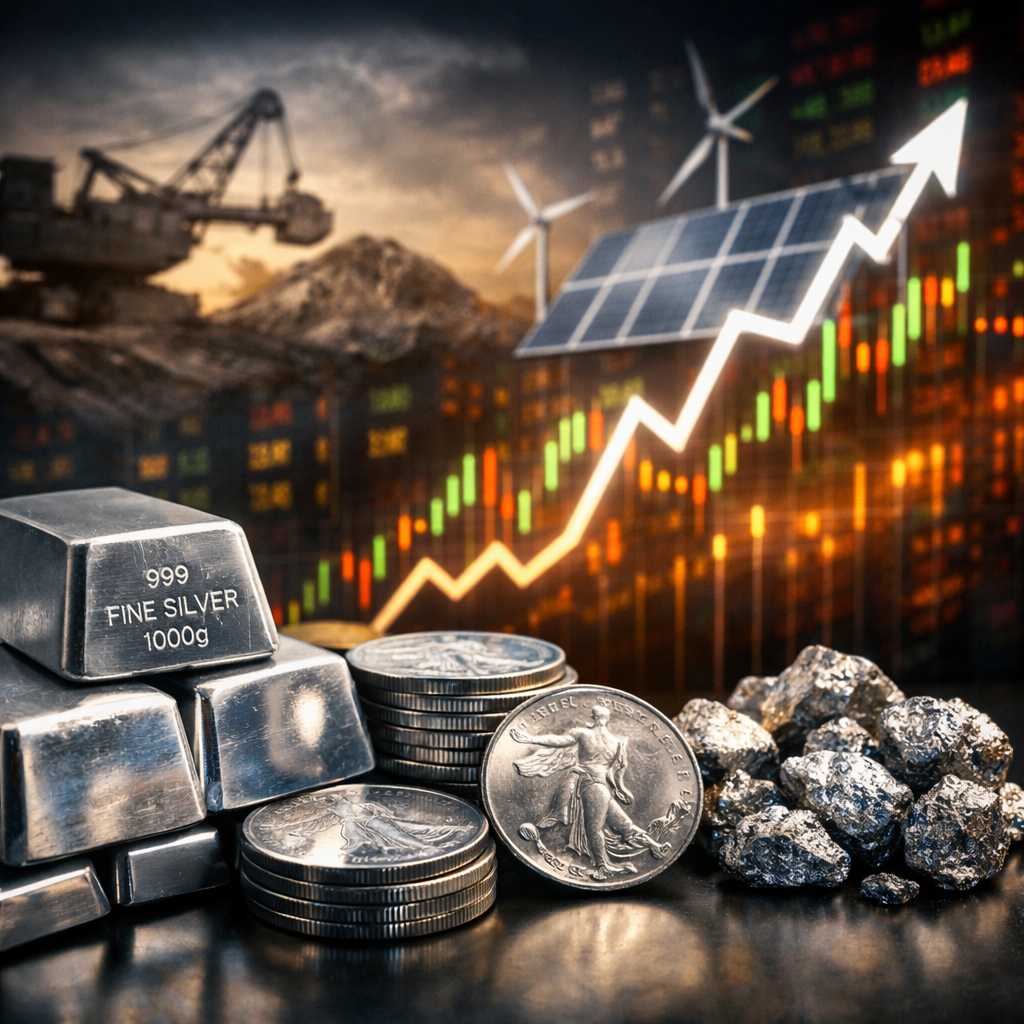
The silver price trades like a hybrid: part precious metal (macro/monetary), part industrial metal (growth/manufacturing). That dual identity is why the silver market can accelerate when macro conditions and industrial narratives point in the same direction.
1) Rate expectations and real yields
A major tailwind cited across markets has been expectations around easier policy ahead (rate cuts or a more dovish stance), which tends to support precious metals by lowering the opportunity cost of holding non-yielding assets. Reuters noted this “rate-cut expectation” backdrop alongside strong precious-metals performance in 2025.
When real yields fall (or are expected to fall), spot silver often benefits—especially if investors treat the move as a durable regime shift rather than a one-week trade.
2) Risk sentiment and safe-haven flows
Silver can behave like a risk hedge when geopolitical risk rises, but it can also fade when tensions cool and traders de-risk. Reuters explicitly tied the late-December pullback in metals to profit-taking and a shift in geopolitics/risk sentiment.
For silver market participants, the takeaway is simple: XAG/USD can swing on headlines, even when the longer-term supply/demand story is constructive.
Supply and demand: the structural story supporting the silver market
Beyond macro, the silver market has been leaning on an underlying structural narrative: tightness and recurring deficits.
The Silver Institute has repeatedly emphasized the concept of an ongoing deficit backdrop, including commentary pointing to a multi-year pattern and expectations of continued imbalance.
Their flagship annual publication, World Silver Survey 2025, is one of the key reference points market participants use to frame silver supply, silver demand, and inventories.
Why deficits matter for the silver price
In plain terms, a deficit narrative tends to do three things in the silver market:
- It makes rallies feel “fundamentally justified,” which can attract trend-following capital.
- It raises the sensitivity of spot silver to any disruption story (mining, refining, exports).
- It can turn dips into “buy-the-pullback” events—until the market finally exhausts.
Even if yearly demand ebbs and flows, markets often trade the direction of the imbalance and the perceived scarcity of readily available silver.
Industrial demand: why the silver market isn’t just a “precious metal” story
A big reason the silver market has been so reactive is silver’s role as an industrial input. Silver is used across electrification and modern manufacturing—exactly the sectors investors keep returning to when they look for multi-year demand growth.
Recent reporting has highlighted silver’s importance in technology-linked demand themes (electrification, energy transition, and more), reinforcing the idea that the silver price can be driven by more than just inflation hedging.
IVTFX view: this “industrial-plus-monetary” mix is what makes silver uniquely prone to powerful trend years. When investors believe industrial demand is resilient and macro conditions support metals, XAG/USD can move faster than gold—both up and down.
Policy and supply risk: why headlines can move spot silver quickly
In tight markets, marginal changes matter. That’s why policy headlines can hit the silver price hard—especially when they affect the perception of supply.
- Reuters reported silver’s 2025 surge being linked to supply shortage narratives and the metal’s positioning within broader “critical mineral” discussions.
- Separate reporting has pointed to export-related constraints as a supply concern, amplifying scarcity psychology in the silver market.
You don’t need to assume a permanent supply shock to respect the market reality: when traders believe supply could tighten further, XAG/USD risk premiums rise.
Investment flows: ETFs and “paper silver” exposure
Investment vehicles matter because they change the speed at which capital can enter (or exit) the silver market.
One of the most widely used instruments is the iShares Silver Trust (SLV), which is designed to generally reflect the performance of the price of silver.
When ETF flows accelerate:
- they can amplify spot moves,
- tighten nearby liquidity,
- and reinforce momentum in the silver price.
When ETF flows reverse:
- they can intensify pullbacks (especially after vertical rallies).
Technical structure: levels, trend behavior, and what IVTFX watches on XAG/USD
Fundamentals set the stage, but the silver price trades technically.
Based on late-December action, IVTFX frames the chart like this:
- Key resistance zone: the $80–$84/oz region, where silver recently spiked to record levels.
- First support zone: mid-$70s, where the market recently pulled back after the spike.
- Deeper support zone: low-$70s/high-$60s, where prior consolidation zones often become “decision points” if volatility continues.
How to interpret this (without overfitting):
- If XAG/USD reclaims $80 and holds, trend traders will treat it as “breakout acceptance.”
- If XAG/USD repeatedly fails near $80, the market may be signaling exhaustion and rotation.
- In a high-volatility silver market, levels are zones—not single-price “magic numbers.”
2026 scenarios for the silver market: bull, base, bear
Bull case: scarcity + easing policy + industrial resilience
In the bullish setup, the silver price stays supported by the deficit narrative while macro expectations remain favorable for precious metals. If supply concerns keep resurfacing, spot silver can remain in a “risk premium” regime.
What you’d likely see:
- strong dips getting bought quickly,
- repeated tests of $80+,
- higher realized volatility in XAG/USD.
Base case: range trade with violent swings
Silver can spend time digesting a huge yearly move. In that environment, the silver market often becomes two-sided: breakouts fail, breakdowns reverse, and the silver price churns in wide ranges.
What you’d likely see:
- frequent whipsaws around major levels,
- sharp rallies and sharp pullbacks,
- options premiums staying elevated.
Bear case: growth scare + liquidation + stronger dollar impulse
If risk assets wobble and liquidity tightens, silver can underperform gold due to its industrial linkage. A growth scare can reduce the market’s willingness to pay a scarcity premium—at least temporarily—especially if positioning is crowded after a big year.
How traders approach the silver market: IVTFX risk notes
Because the silver market can move fast, the biggest edge often comes from risk structure rather than prediction.
- Position sizing matters more in silver than in calmer markets.
- Volatility-based stops (or wider invalidation zones) often outperform tight stops in XAG/USD.
- Avoid “all-in” thinking. Silver trends can be powerful, but the pullbacks can be brutal.
- If using ETFs like SLV, remember you’re still taking silver price risk—just through a wrapper designed to track silver.
Bottom line: the silver market remains a headline-driven, deficit-themed trend market
The current silver market narrative is a fusion of:
- macro drivers (policy expectations and risk sentiment)
- structural supply/demand tightness (multi-year deficit framing)
- and industrial relevance that keeps silver in the “strategic metal” conversation.
For IVTFX, the practical takeaway is that XAG/USD is not just a precious-metal chart—it’s a macro chart, an industrial-demand chart, and a positioning chart all at once. In 2026, traders should expect the silver price to remain opportunity-rich—but only if volatility is respected and risk is engineered thoughtfully.
Disclaimer: This IVTFX material is for informational purposes only and does not constitute investment advice. Trading commodities and derivatives involves substantial risk.